4
Mark for Review
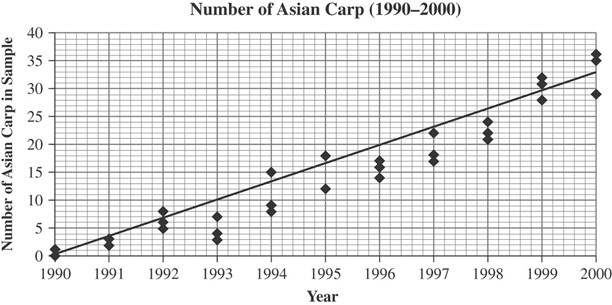
The Asian carp has experienced a rapid growth by displacing other fish in the Mississippi River. A researcher gathered three yearly samples from a 500-meter length of the Upper Mississippi River to determine the population trend of the fish over a decade.
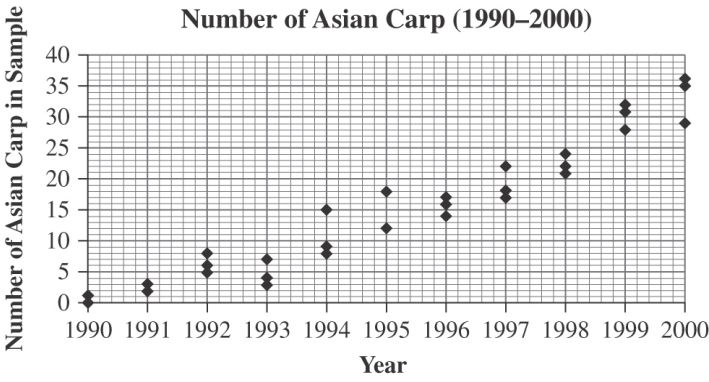
What is the approximate slope of the best-fit line of the data in the graph, expressed as change in carp per year?
A
B
C
D
Correct Answer: A
Your Answer:
Explanation
(A) Some approximate points that would be on the best-fit line are (1990, 0) and (1996,18). Calculate the approximate slope: 18 - 0/1996 - 1990 = 3,
which comes closest to choice (A). You can also visualize this by drawing the approximate best-fit line on the graph: